

> For the complete documentation index, see [llms.txt](https://docs.amitysolutions.com/amity-solutions/llms.txt). Markdown versions of documentation pages are available by appending `.md` to page URLs; this page is available as [Markdown](https://docs.amitysolutions.com/amity-solutions/amity-bots-live-chat/livechat-dashboard.md).

# Livechat Dashboard

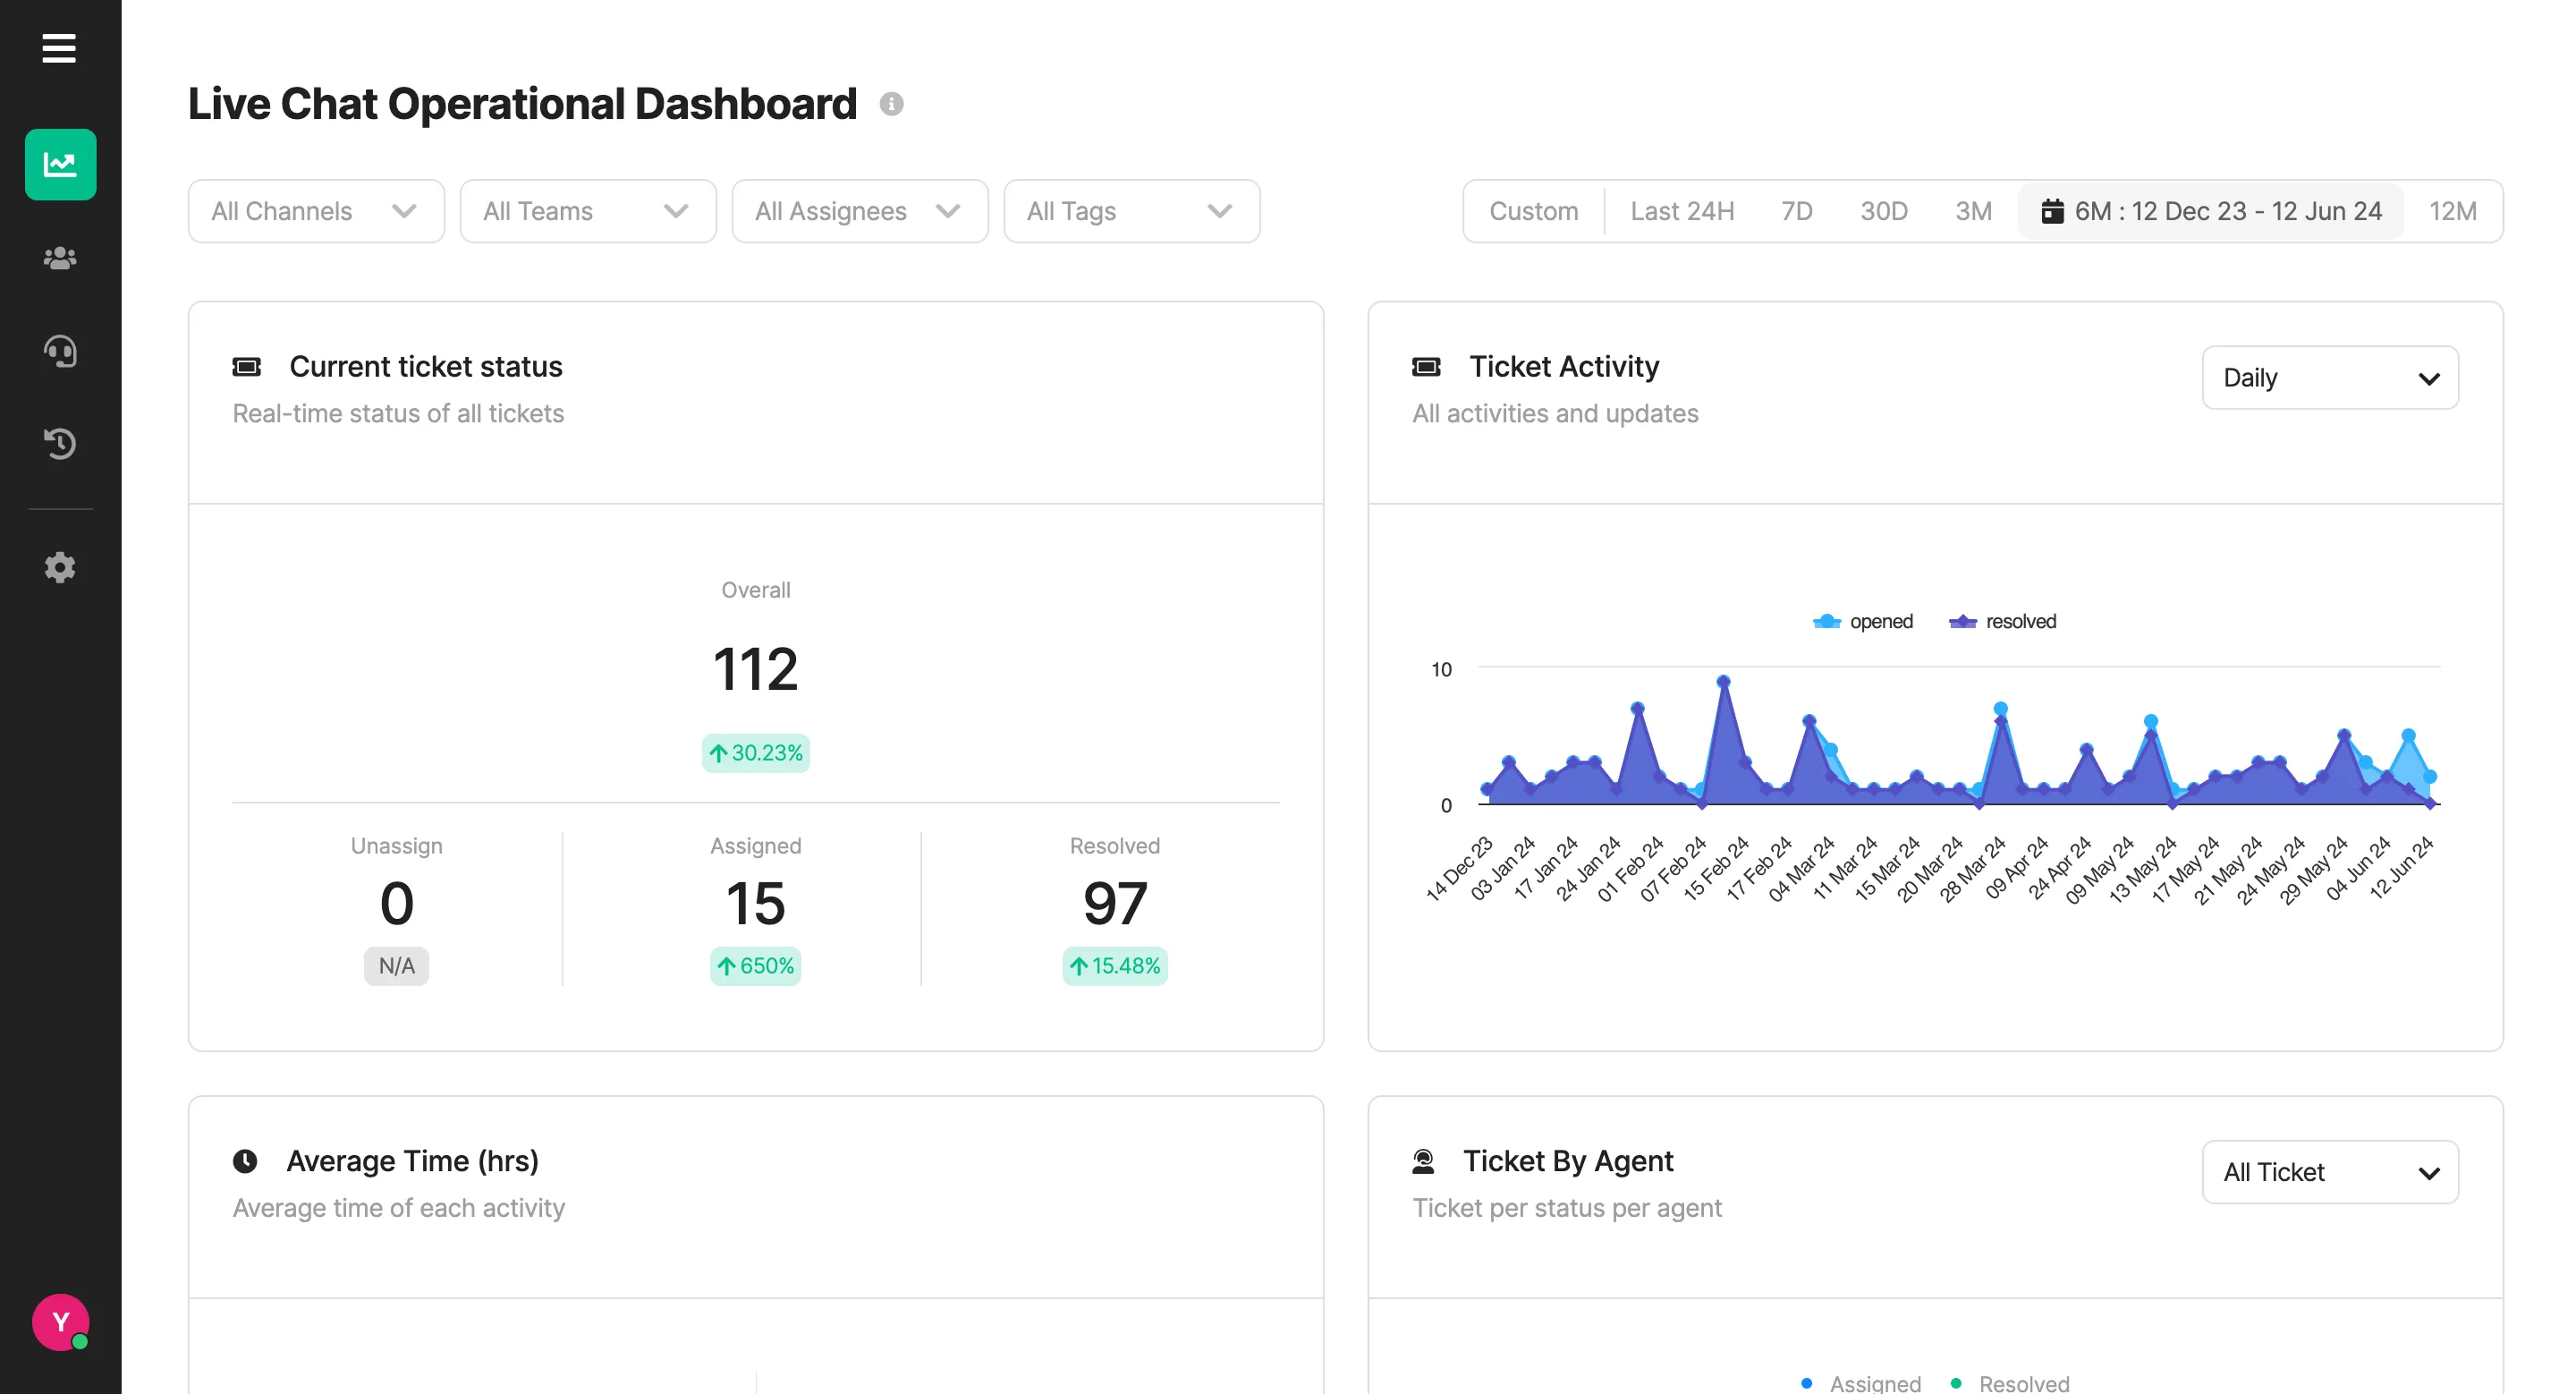
Live chat operational dashboard illustrated Agent and Supervisor performances for admin and supervisor monitoring. Tickets in this dashboard start counting upon assignment to a non-default team or SLA initiation. This is means all the ticket that has a conversation are not included in the livechat operational dashboard.
{% hint style="info" %}
Filtered Ticket: The platform supported filter ticket data by date range of start SLA time.
{% endhint %}

<figure><img src="https://4173380749-files.gitbook.io/~/files/v0/b/gitbook-x-prod.appspot.com/o/spaces%2FzKzxNnOaGxZvAEzvYa7y%2Fuploads%2F7hEX9HwmK2xVBTX6Y8Z9%2FScreenshot%202567-06-12%20at%2013.33.45.png?alt=media&amp;token=86aea464-24c0-44e1-bd83-8758ab634800" alt=""><figcaption></figcaption></figure>

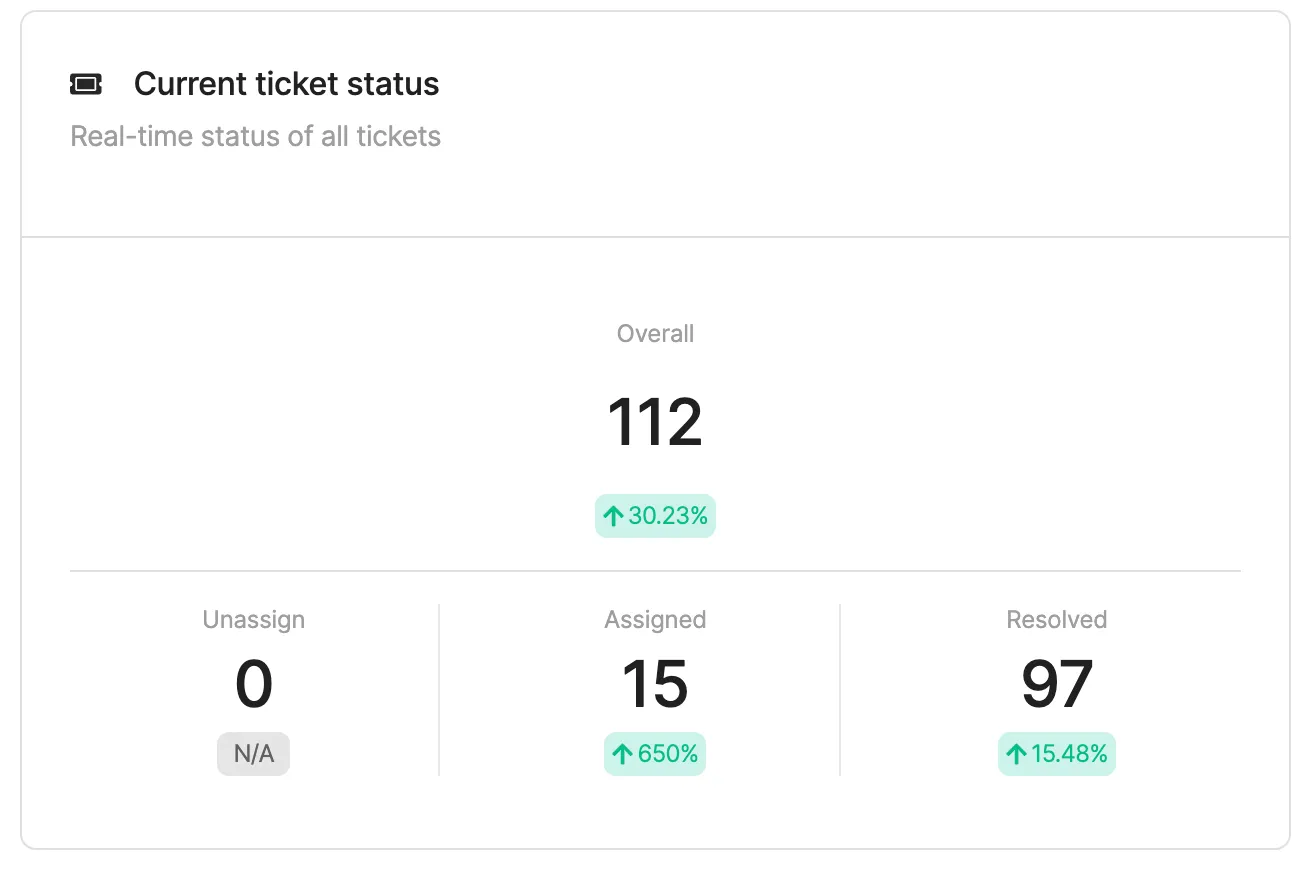
### Current ticket status

Live updates on ticket status as an Unassigned, Assigned, Resolved, and Overall in selected range of time
<figure><img src="https://4173380749-files.gitbook.io/~/files/v0/b/gitbook-x-prod.appspot.com/o/spaces%2FzKzxNnOaGxZvAEzvYa7y%2Fuploads%2Fb6s9hbDO3iRZyNLo13D7%2FScreenshot%202567-06-12%20at%2014.14.29.png?alt=media&amp;token=e1d3143b-99cc-46ce-b16e-71ecf26a9a3f" alt="" width="563"><figcaption></figcaption></figure>

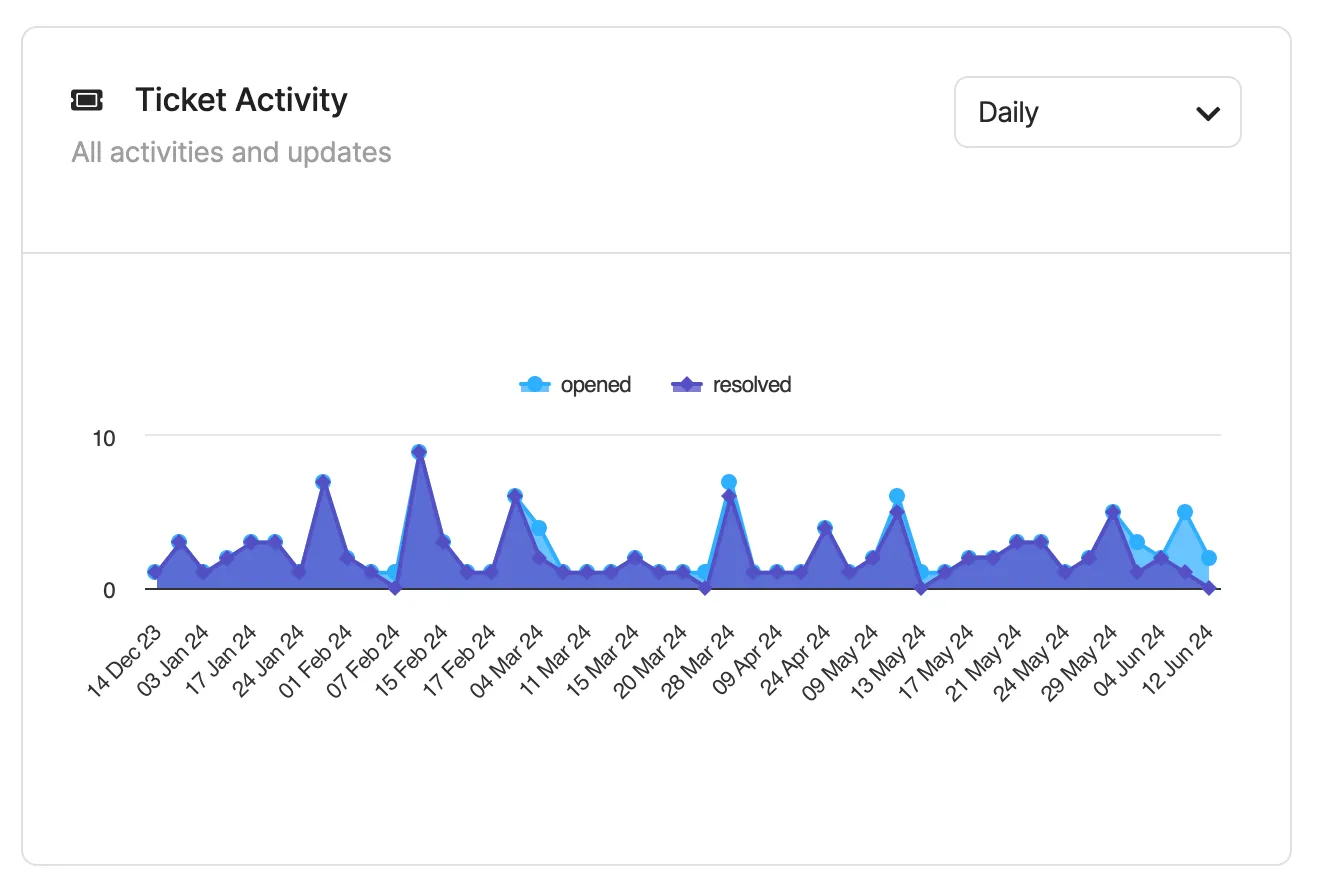
### Ticket Activity

The line graph illustrated the number of opened and resolved ticket in each time frame as a Daily, Monthly, Quarterly, and Yearly
<figure><img src="https://4173380749-files.gitbook.io/~/files/v0/b/gitbook-x-prod.appspot.com/o/spaces%2FzKzxNnOaGxZvAEzvYa7y%2Fuploads%2F9PRrPEUEX6h41ljvwhYP%2FScreenshot%202567-06-12%20at%2014.14.57.png?alt=media&amp;token=2120f13e-27e6-4d0c-bcd7-9d91c6a7660c" alt="" width="563"><figcaption></figcaption></figure>

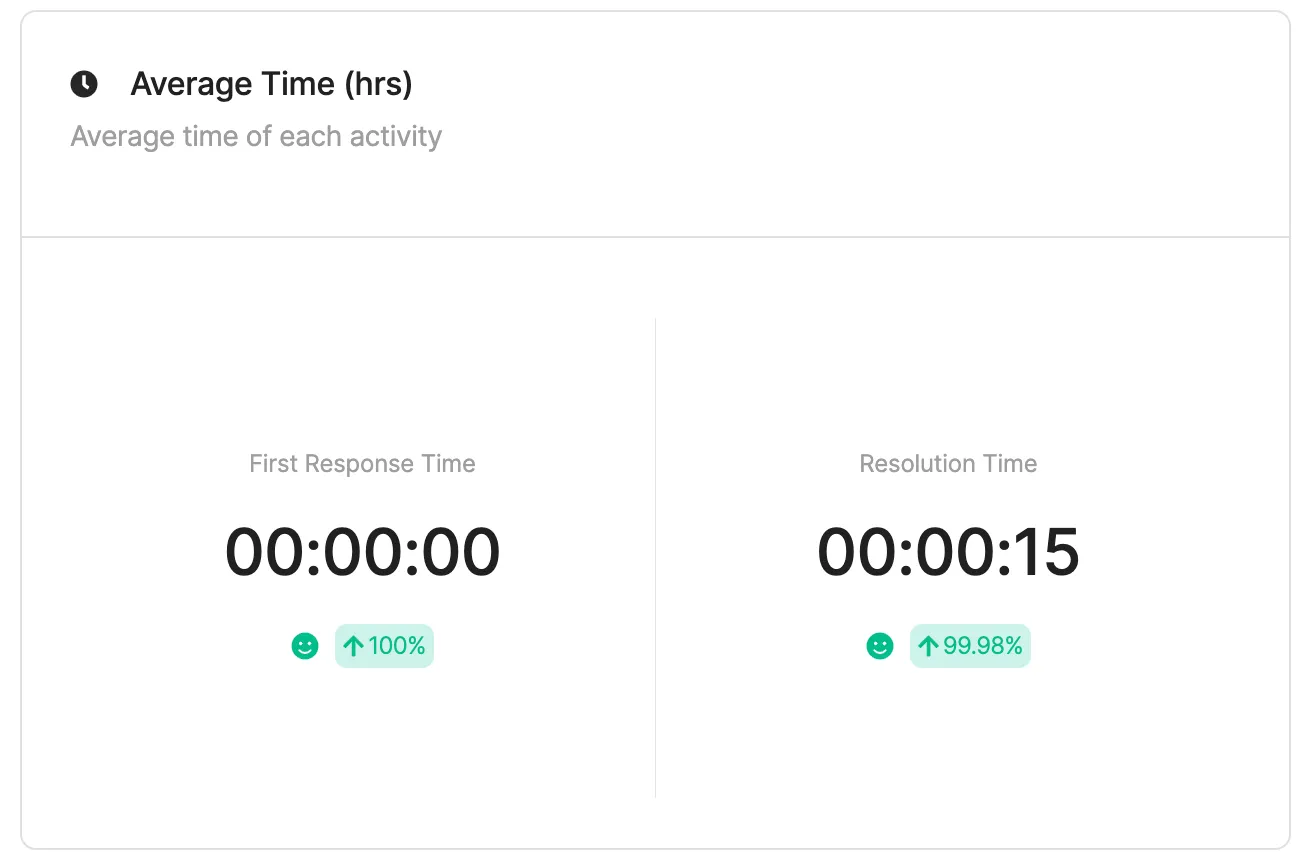
### Average Time

Average time of first time agent respond to customer messages and time period before agent resolved ticket
<figure><img src="https://4173380749-files.gitbook.io/~/files/v0/b/gitbook-x-prod.appspot.com/o/spaces%2FzKzxNnOaGxZvAEzvYa7y%2Fuploads%2FgkrBQNvO9FNS4KfzKlAD%2FScreenshot%202567-06-12%20at%2014.15.49.png?alt=media&amp;token=091b06d2-d83d-4960-ba57-4faa3827ef67" alt="" width="563"><figcaption></figcaption></figure>

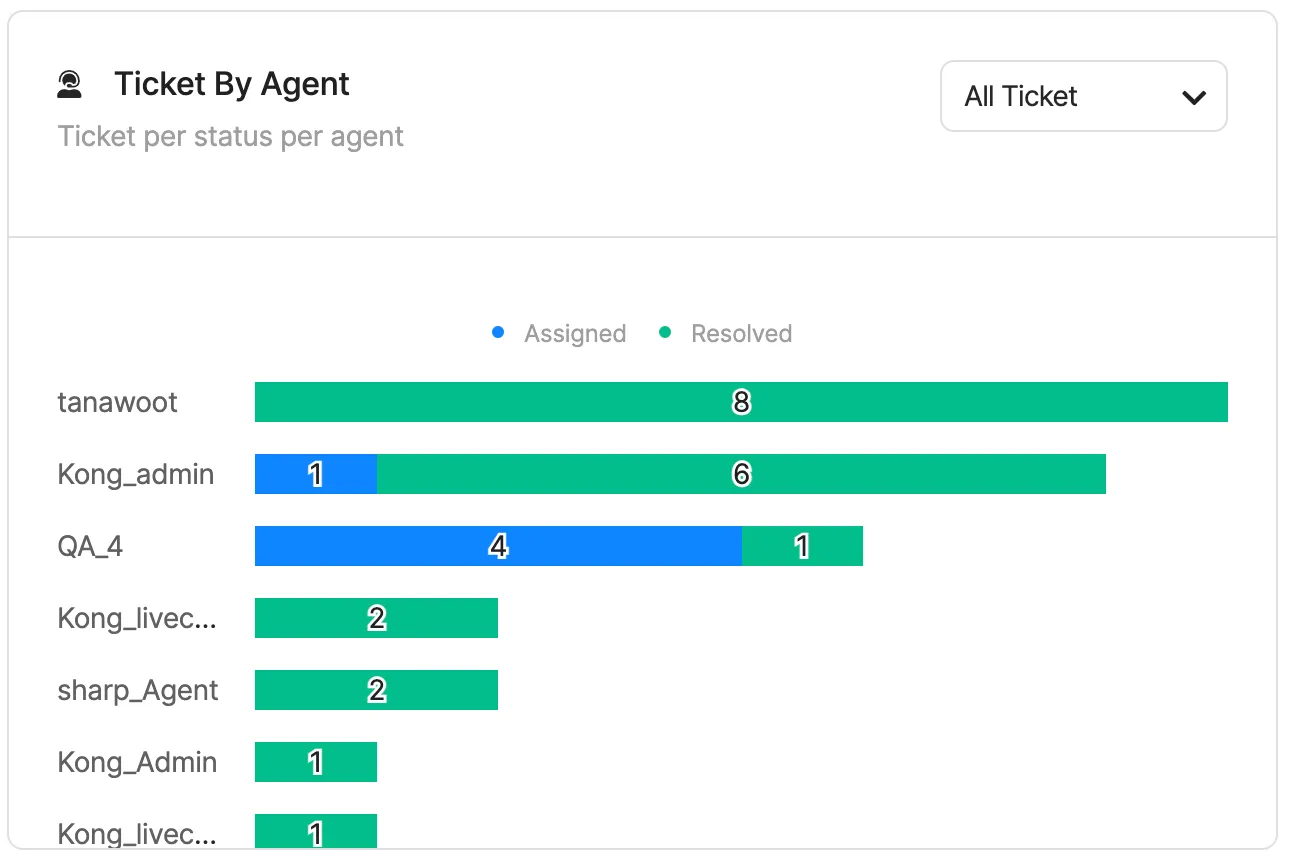
### Ticket By Agent

The bar graph visualized ratio and the number of assigned and resolved tickets for each agent
<figure><img src="https://4173380749-files.gitbook.io/~/files/v0/b/gitbook-x-prod.appspot.com/o/spaces%2FzKzxNnOaGxZvAEzvYa7y%2Fuploads%2FNMywG06Fk1DwszsYp8hO%2FScreenshot%202567-06-12%20at%2014.16.48.png?alt=media&amp;token=33e19af4-4c7e-479f-8226-e5006e9bac0e" alt="" width="563"><figcaption></figcaption></figure>
